🗓️
2026
DeelDash
DeelDash is a mobile analytics app built for car dealerships. It helps teams quickly understand sales performance, model mix, and inventory health without relying on spreadsheets or desktop reports.

Problem Statement
Dealership teams usually have access to data, but not to quick decision-making. Sales numbers, inventory status, and model performance are often spread across spreadsheets, internal tools, and manual updates. This makes it difficult for managers to answer simple questions in real time, such as which cars are selling best, which models are slowing down, or how healthy the inventory is.
Note for recruiters
I’m still refining this portfolio. If you’d like to explore full flows and edge cases in detail, please check the Figma file. Thank you.
Who It’s For

Sneha
40
Needs a fast overview of business health, sales momentum, and stock utilization without opening multiple reports.

Rohit
36
Tracks which models are moving, which periods are underperforming, and where to focus the team’s attention.
Overview Dashboard
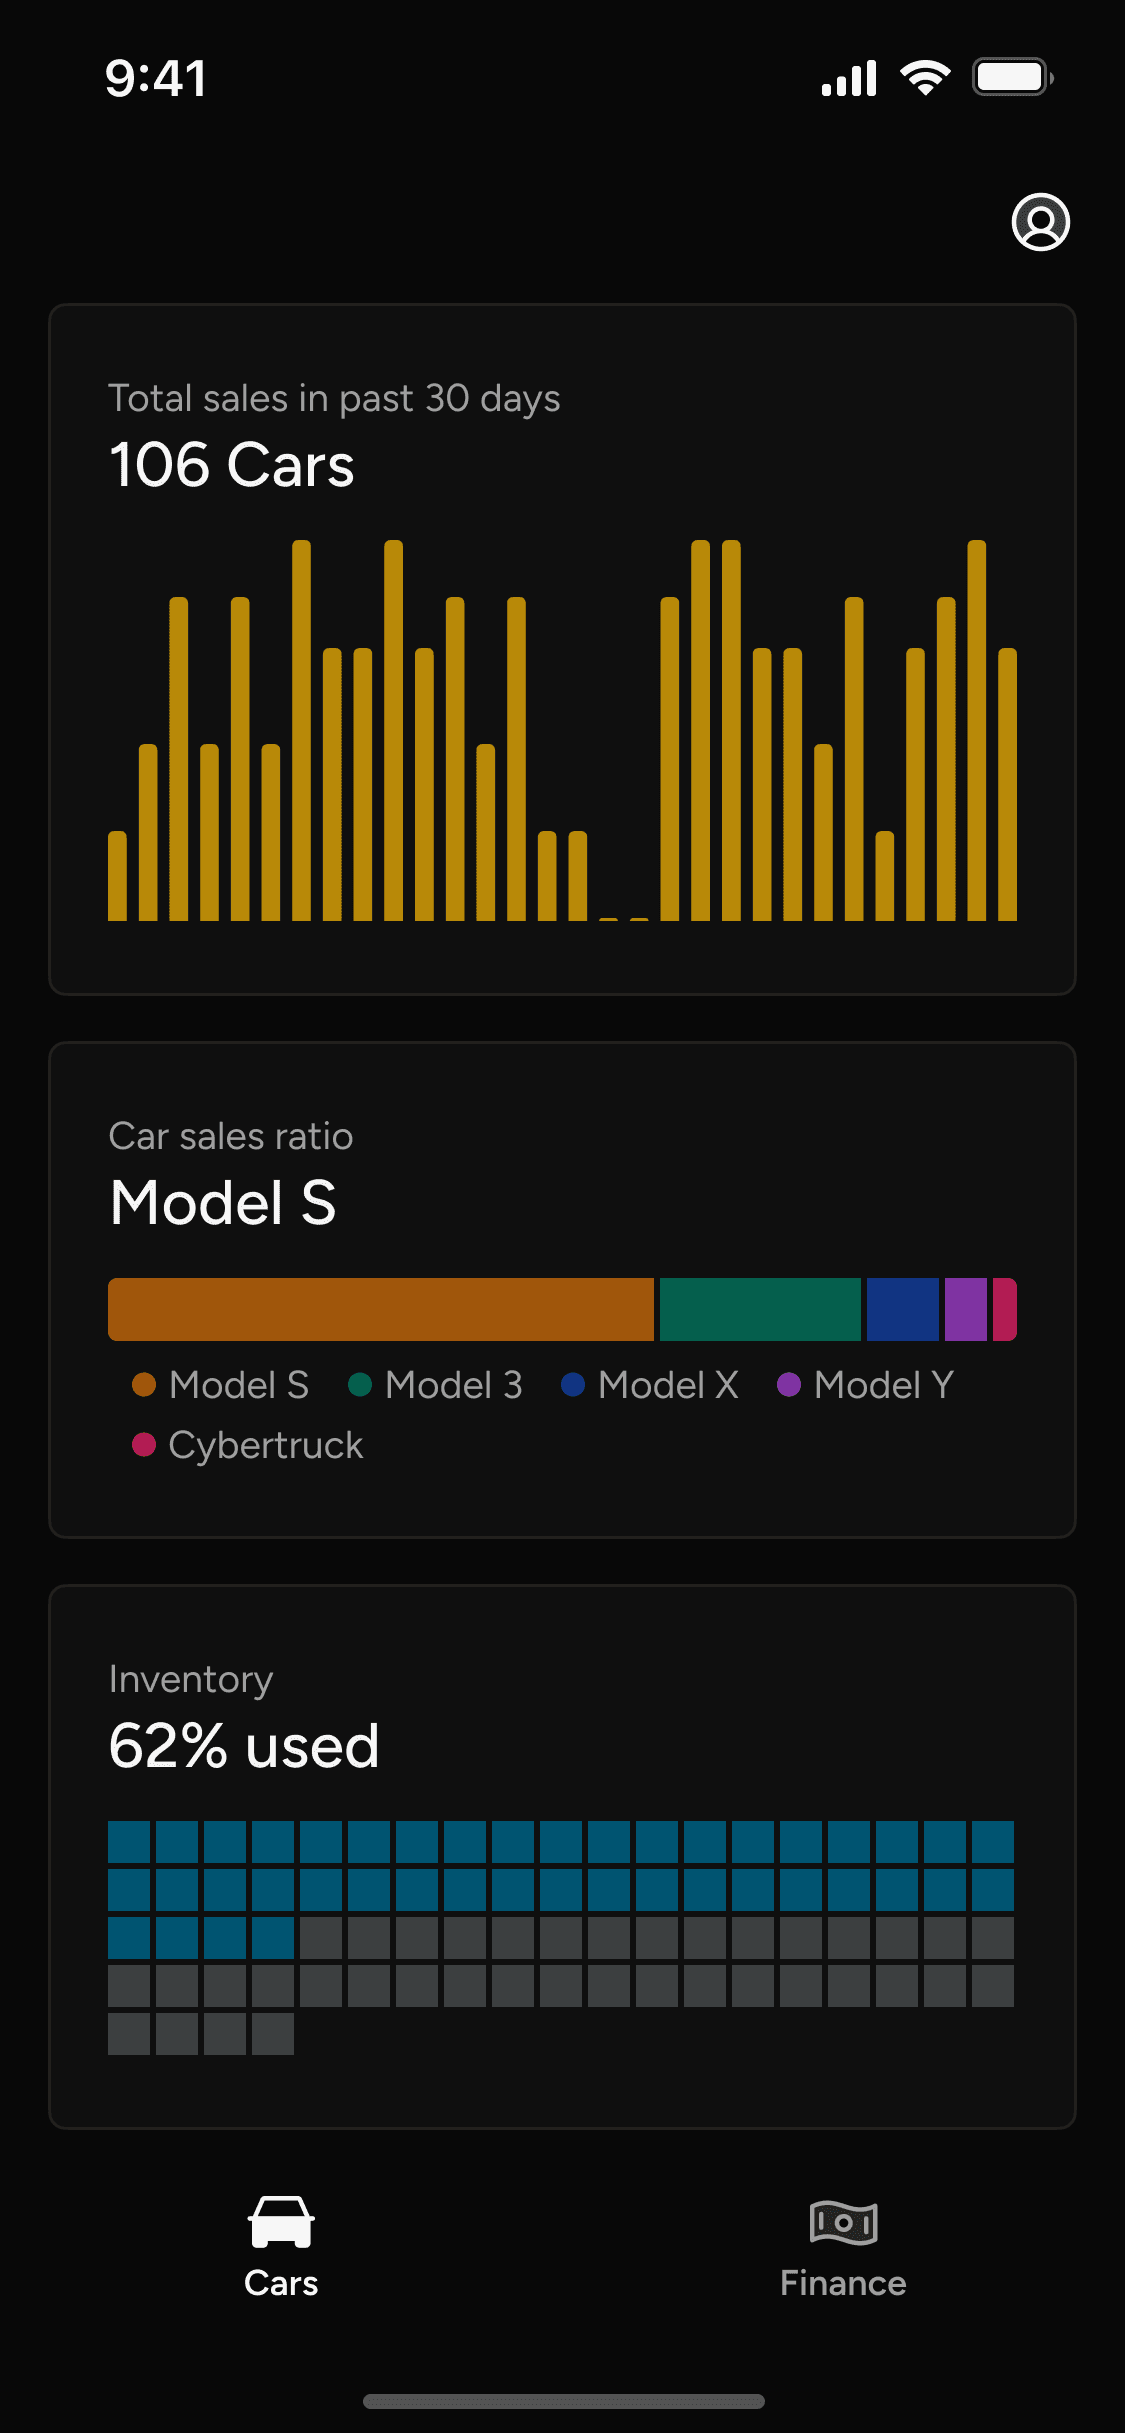
This acts as the main summary hub. It highlights three key metrics: total sales in the last 30 days, car sales ratio, and inventory occupancy. Users get a quick snapshot of performance before exploring deeper.
Car Sales Analytics
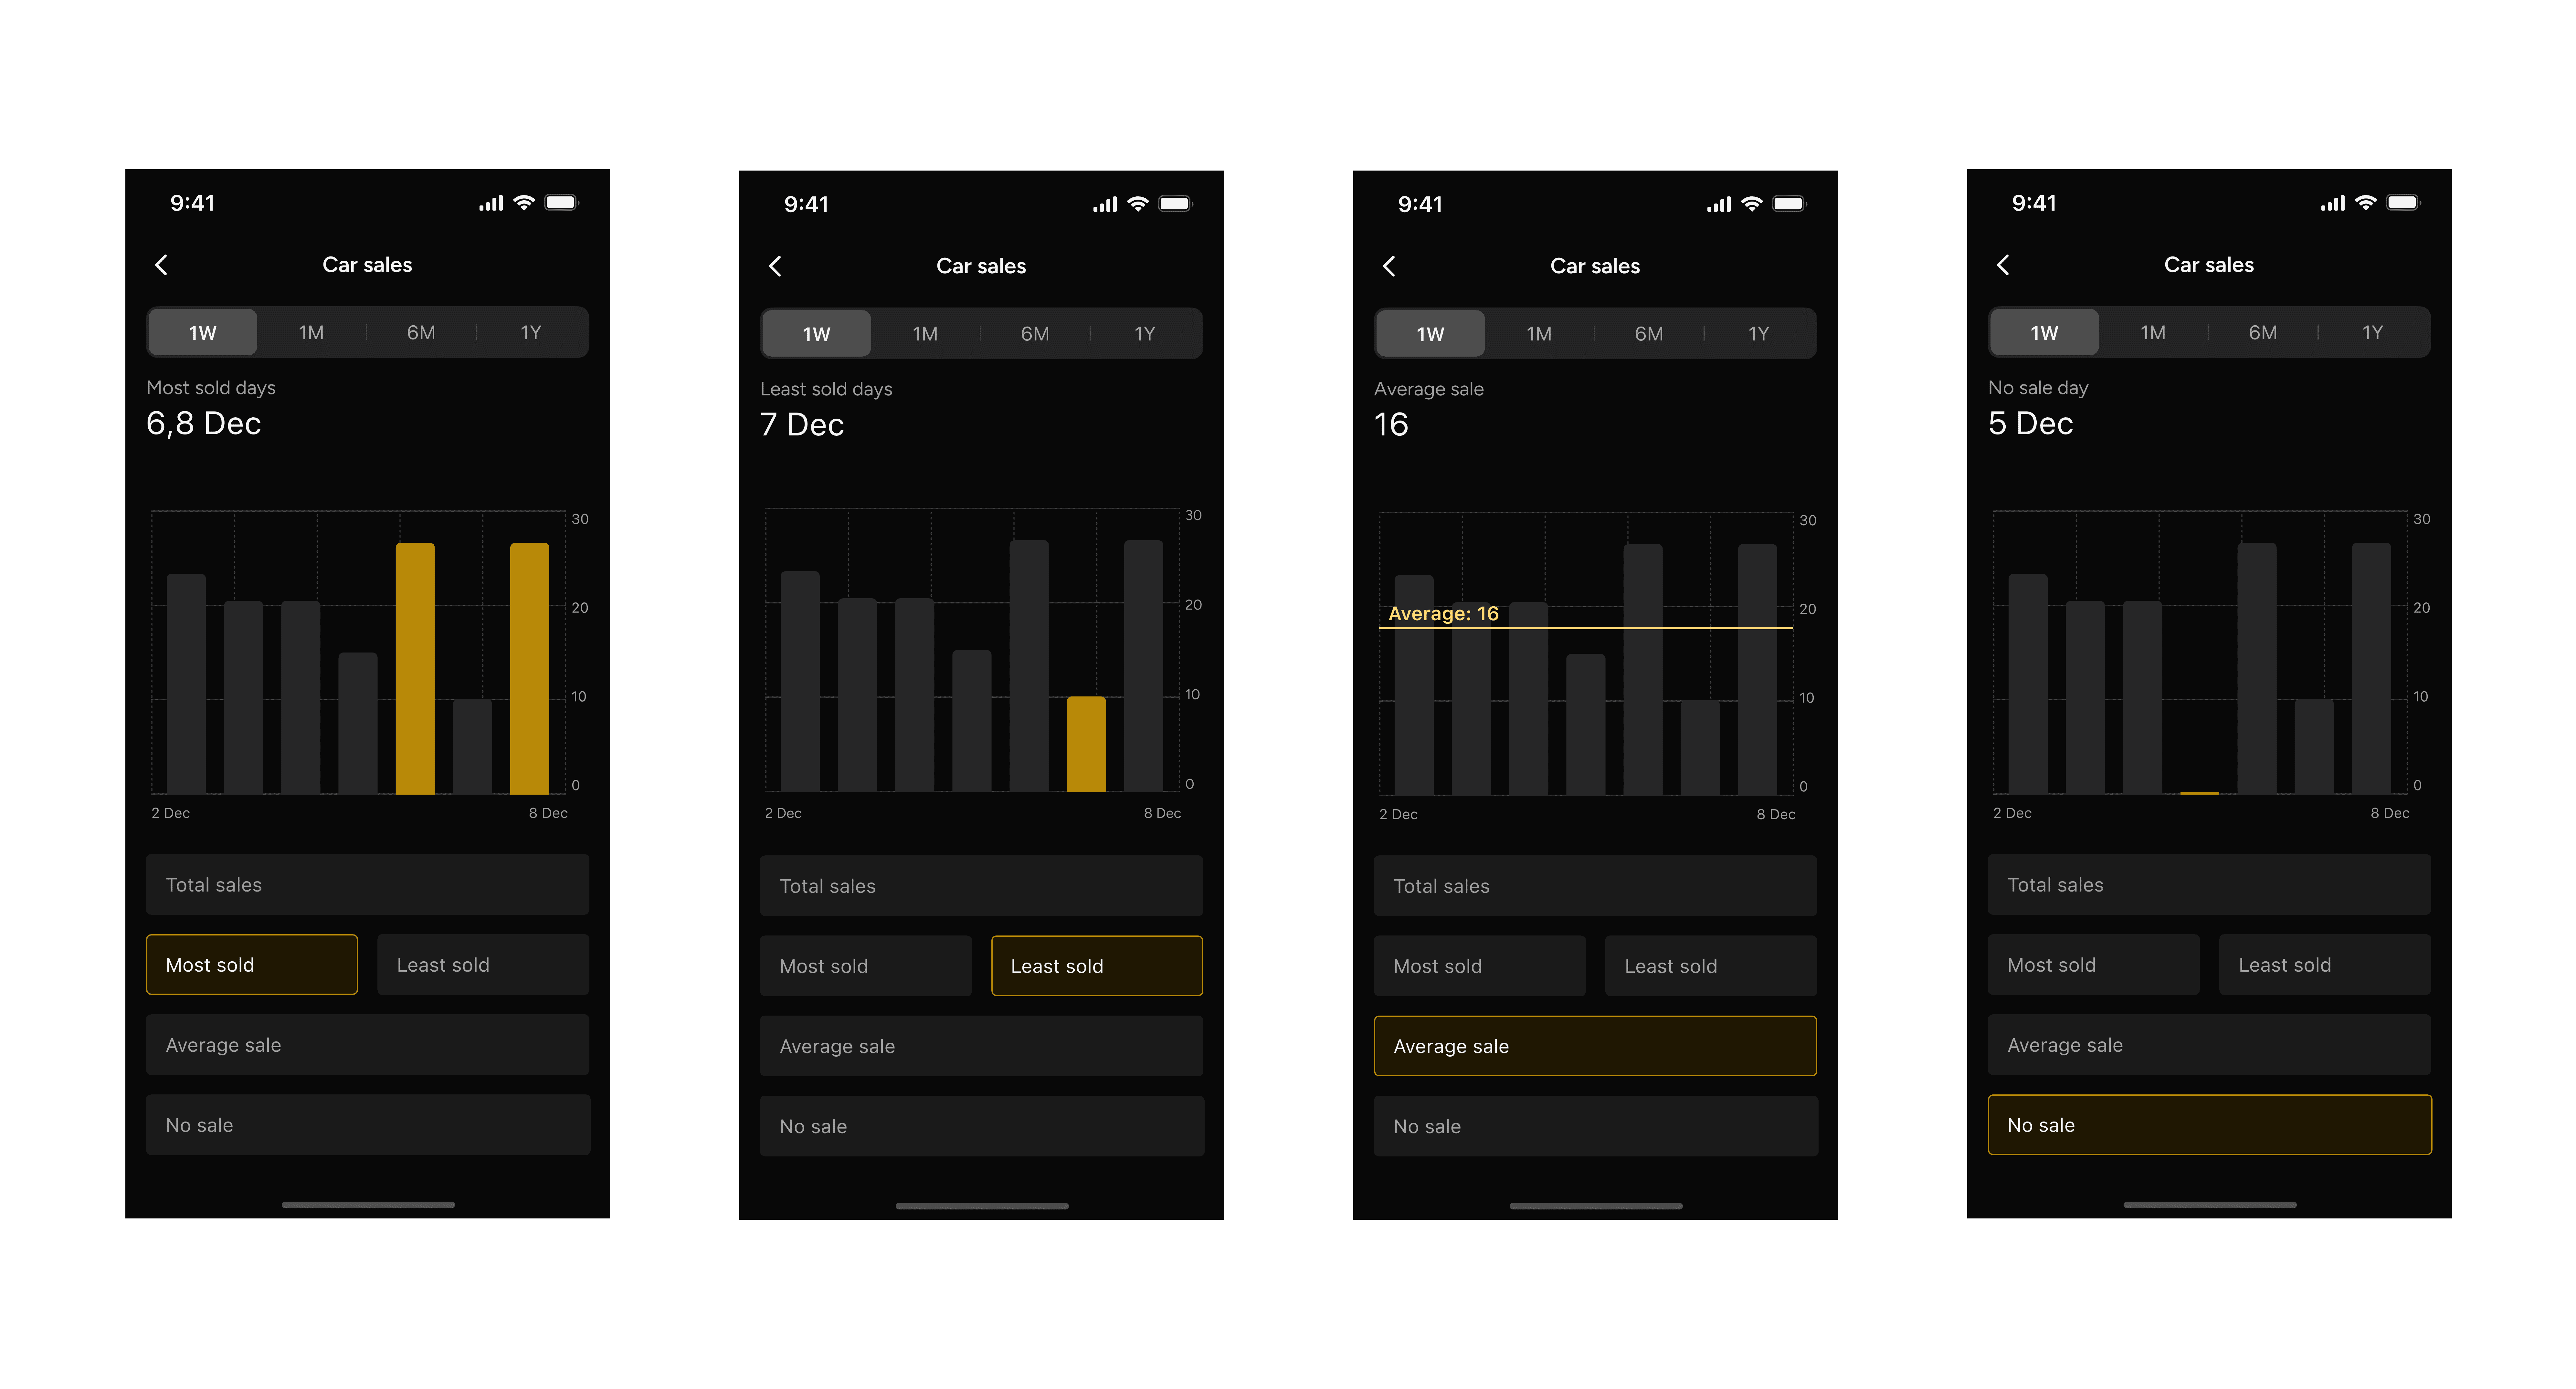
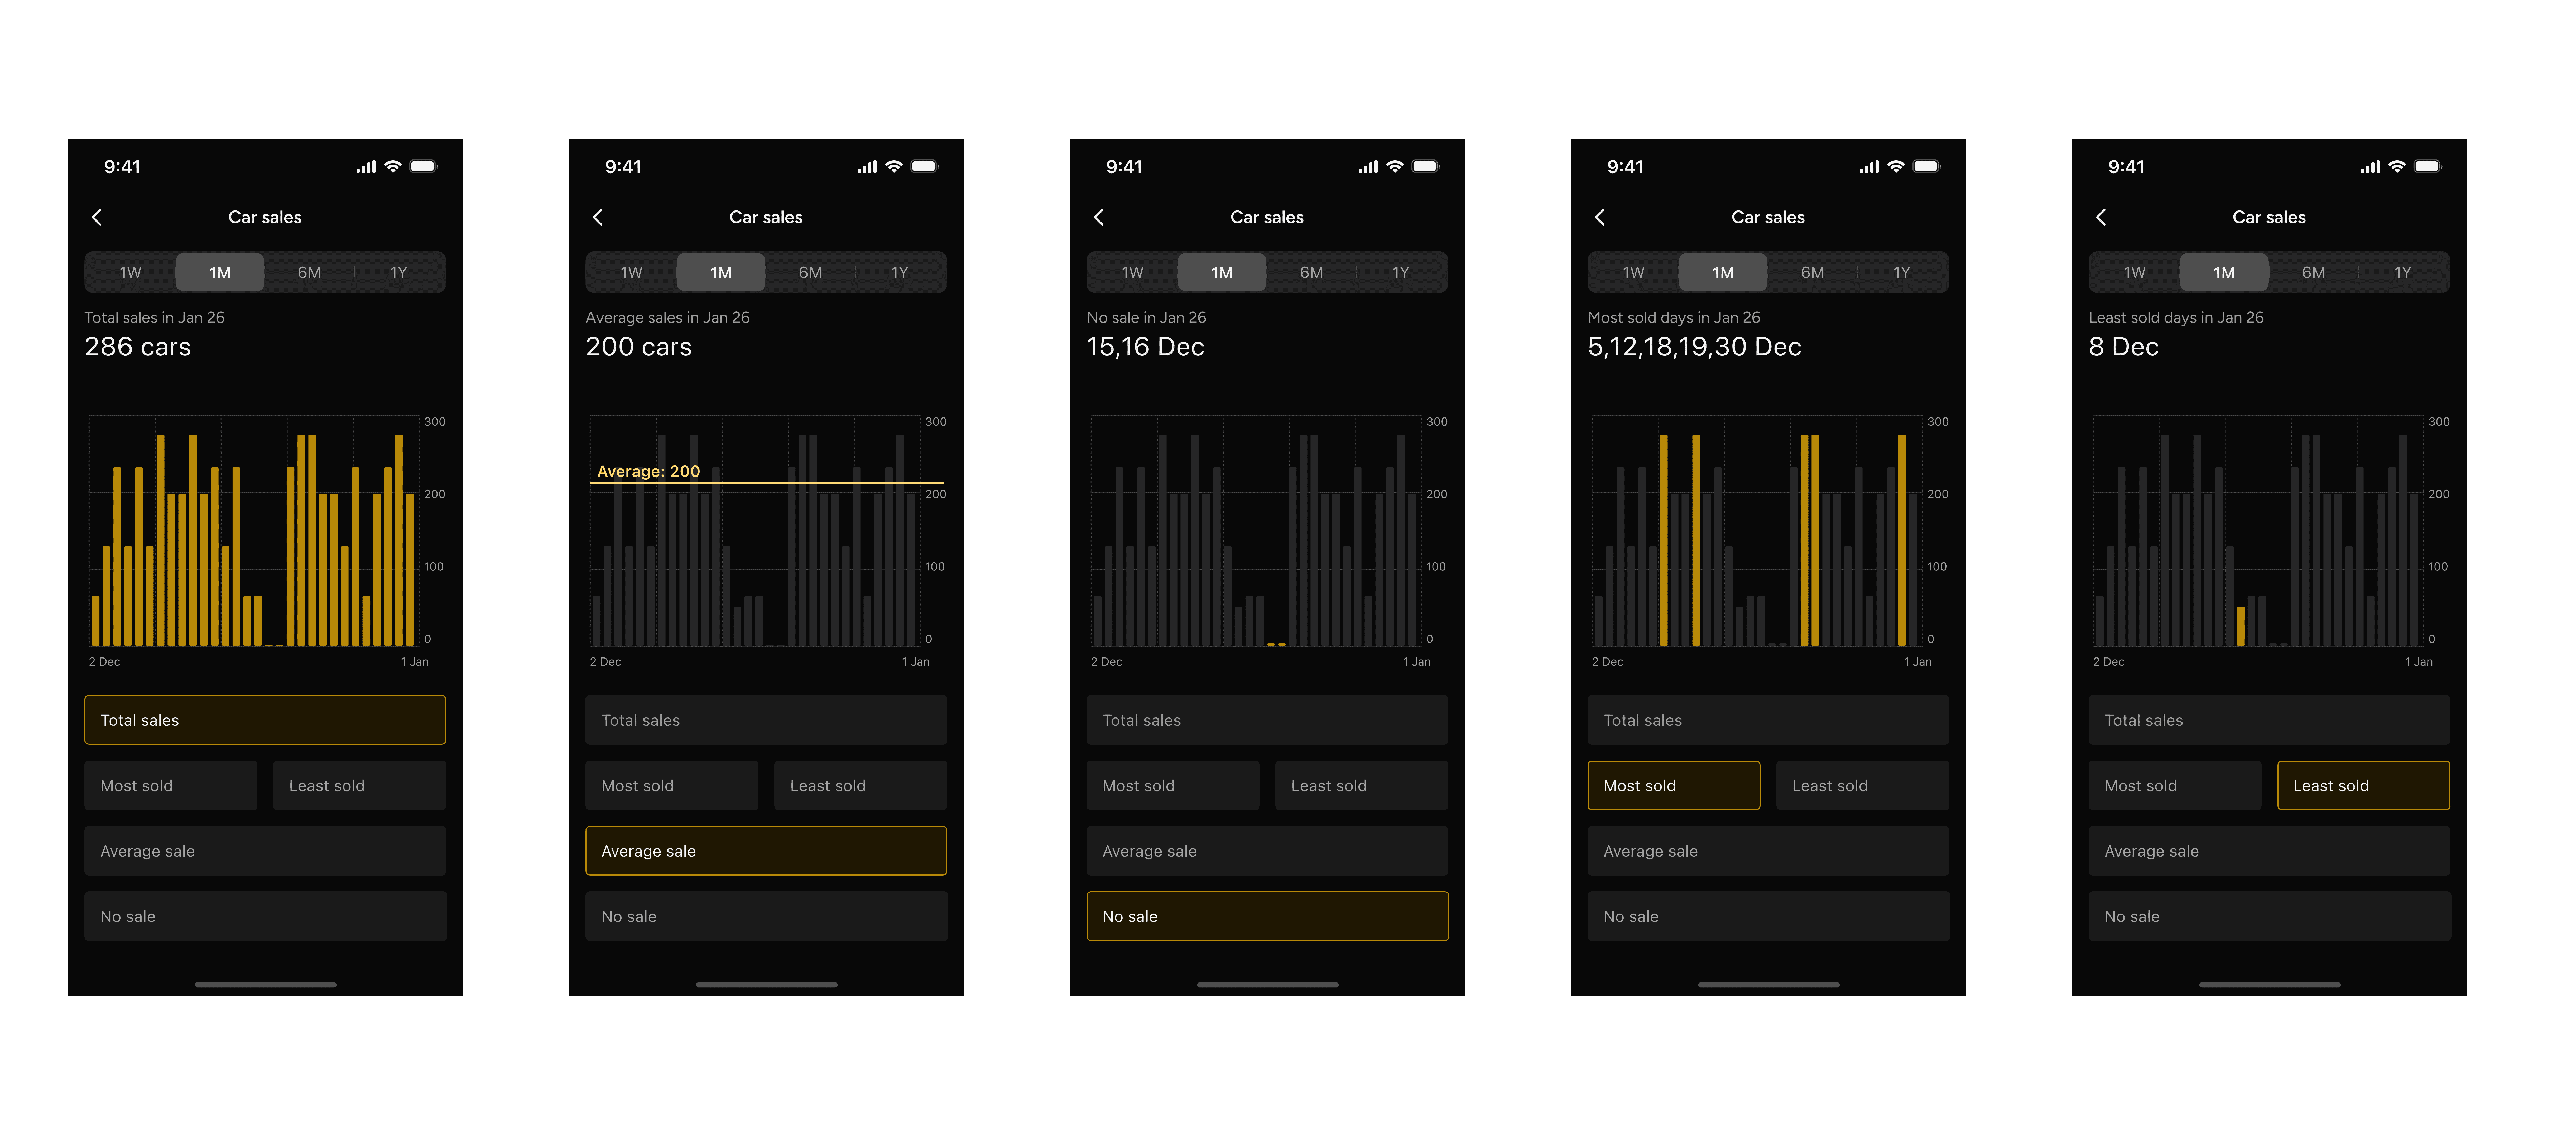
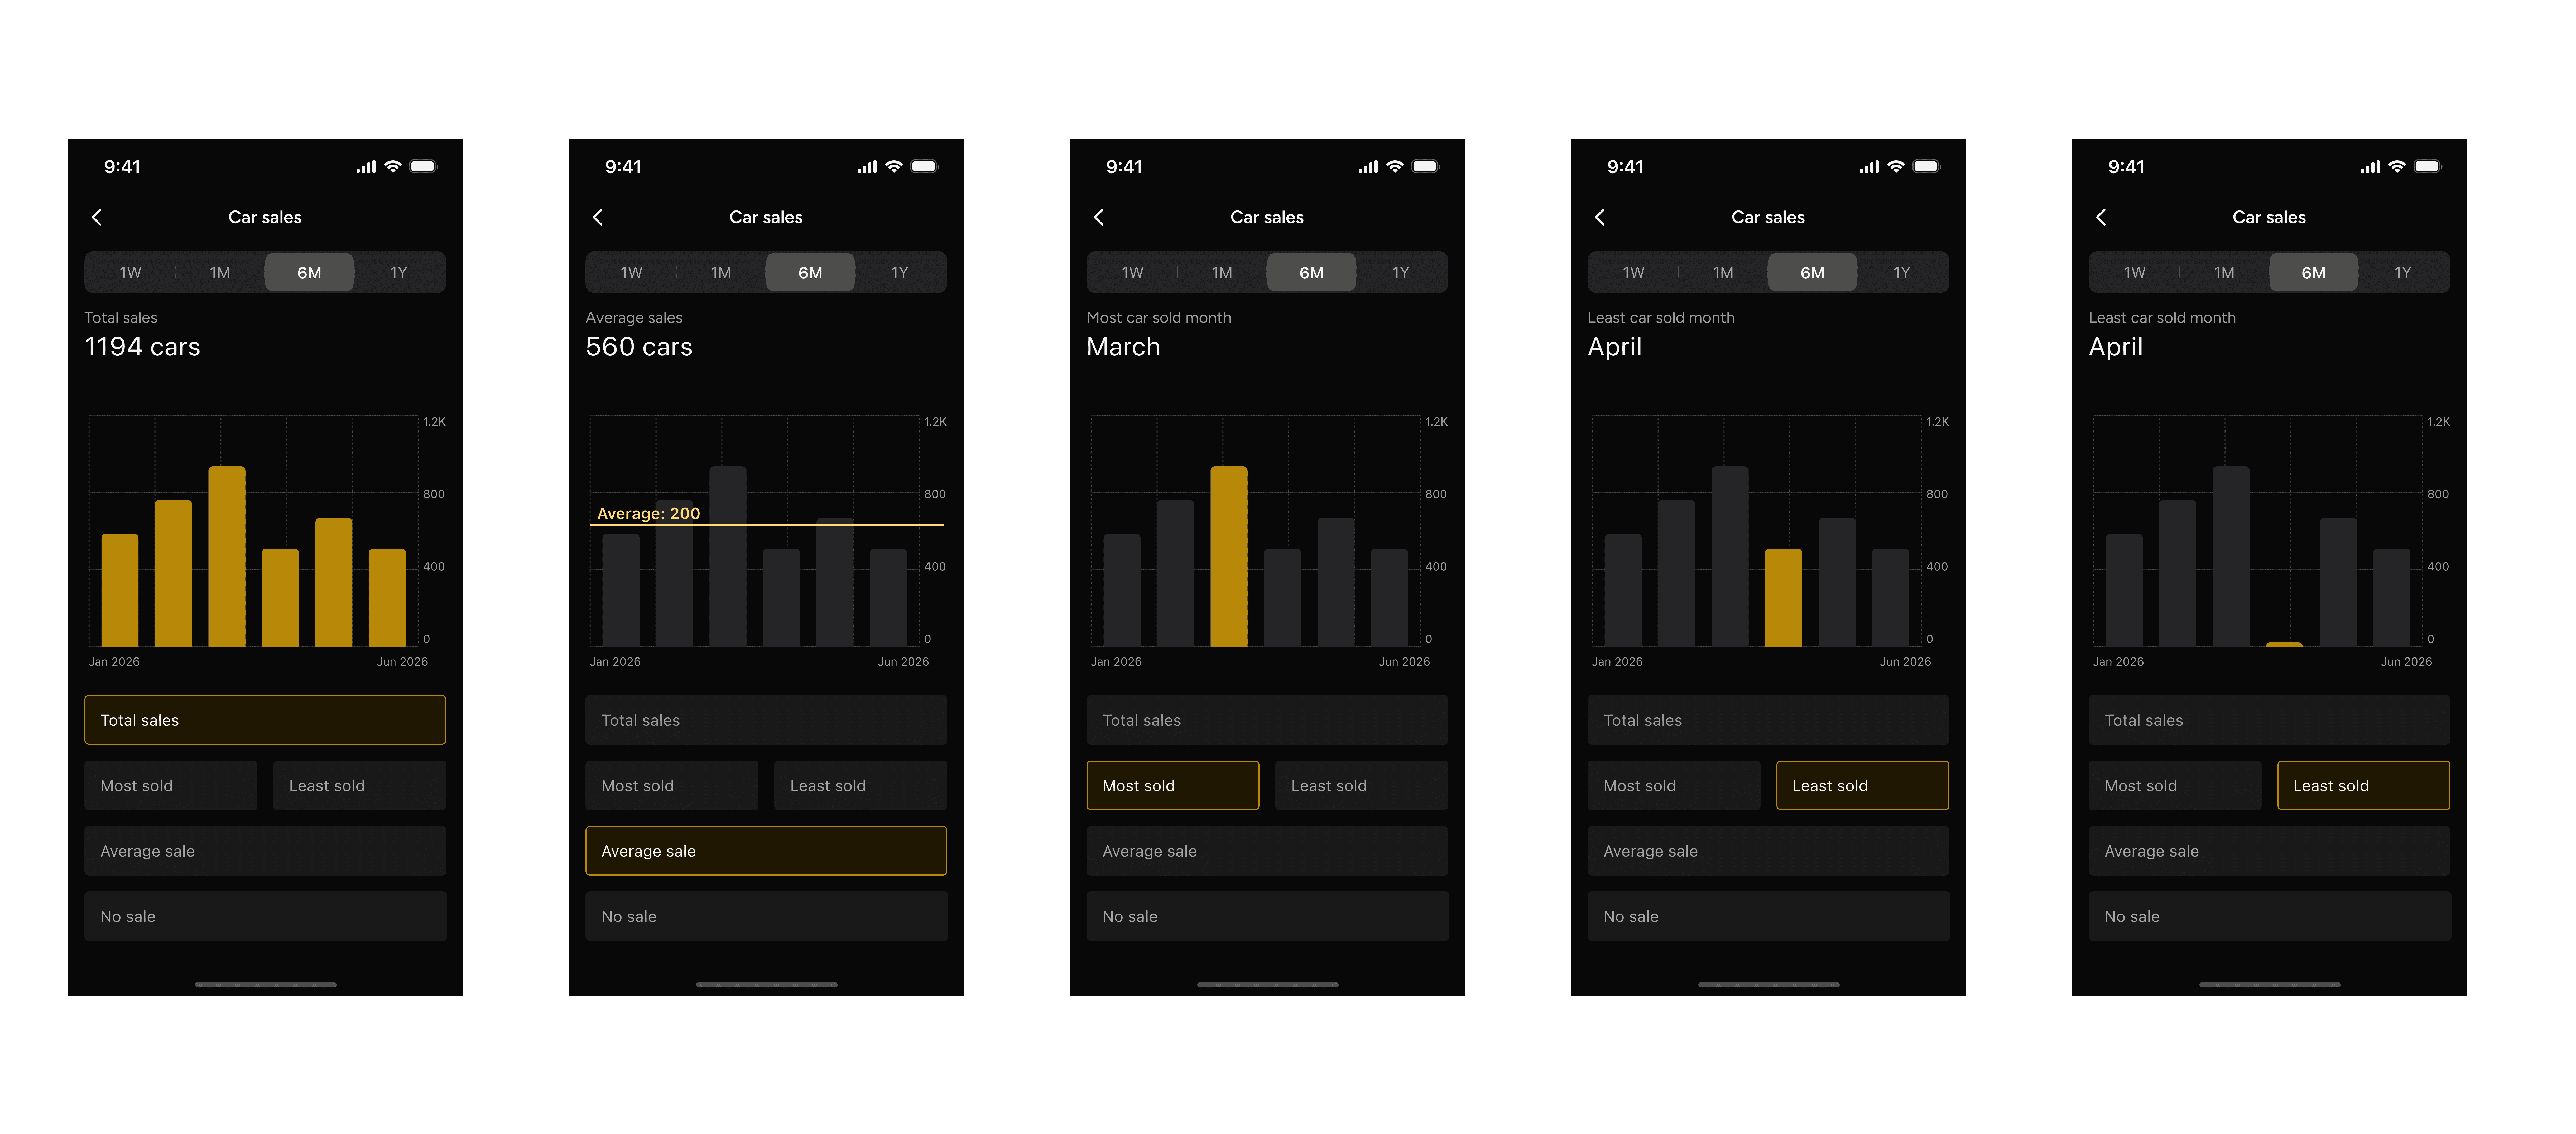
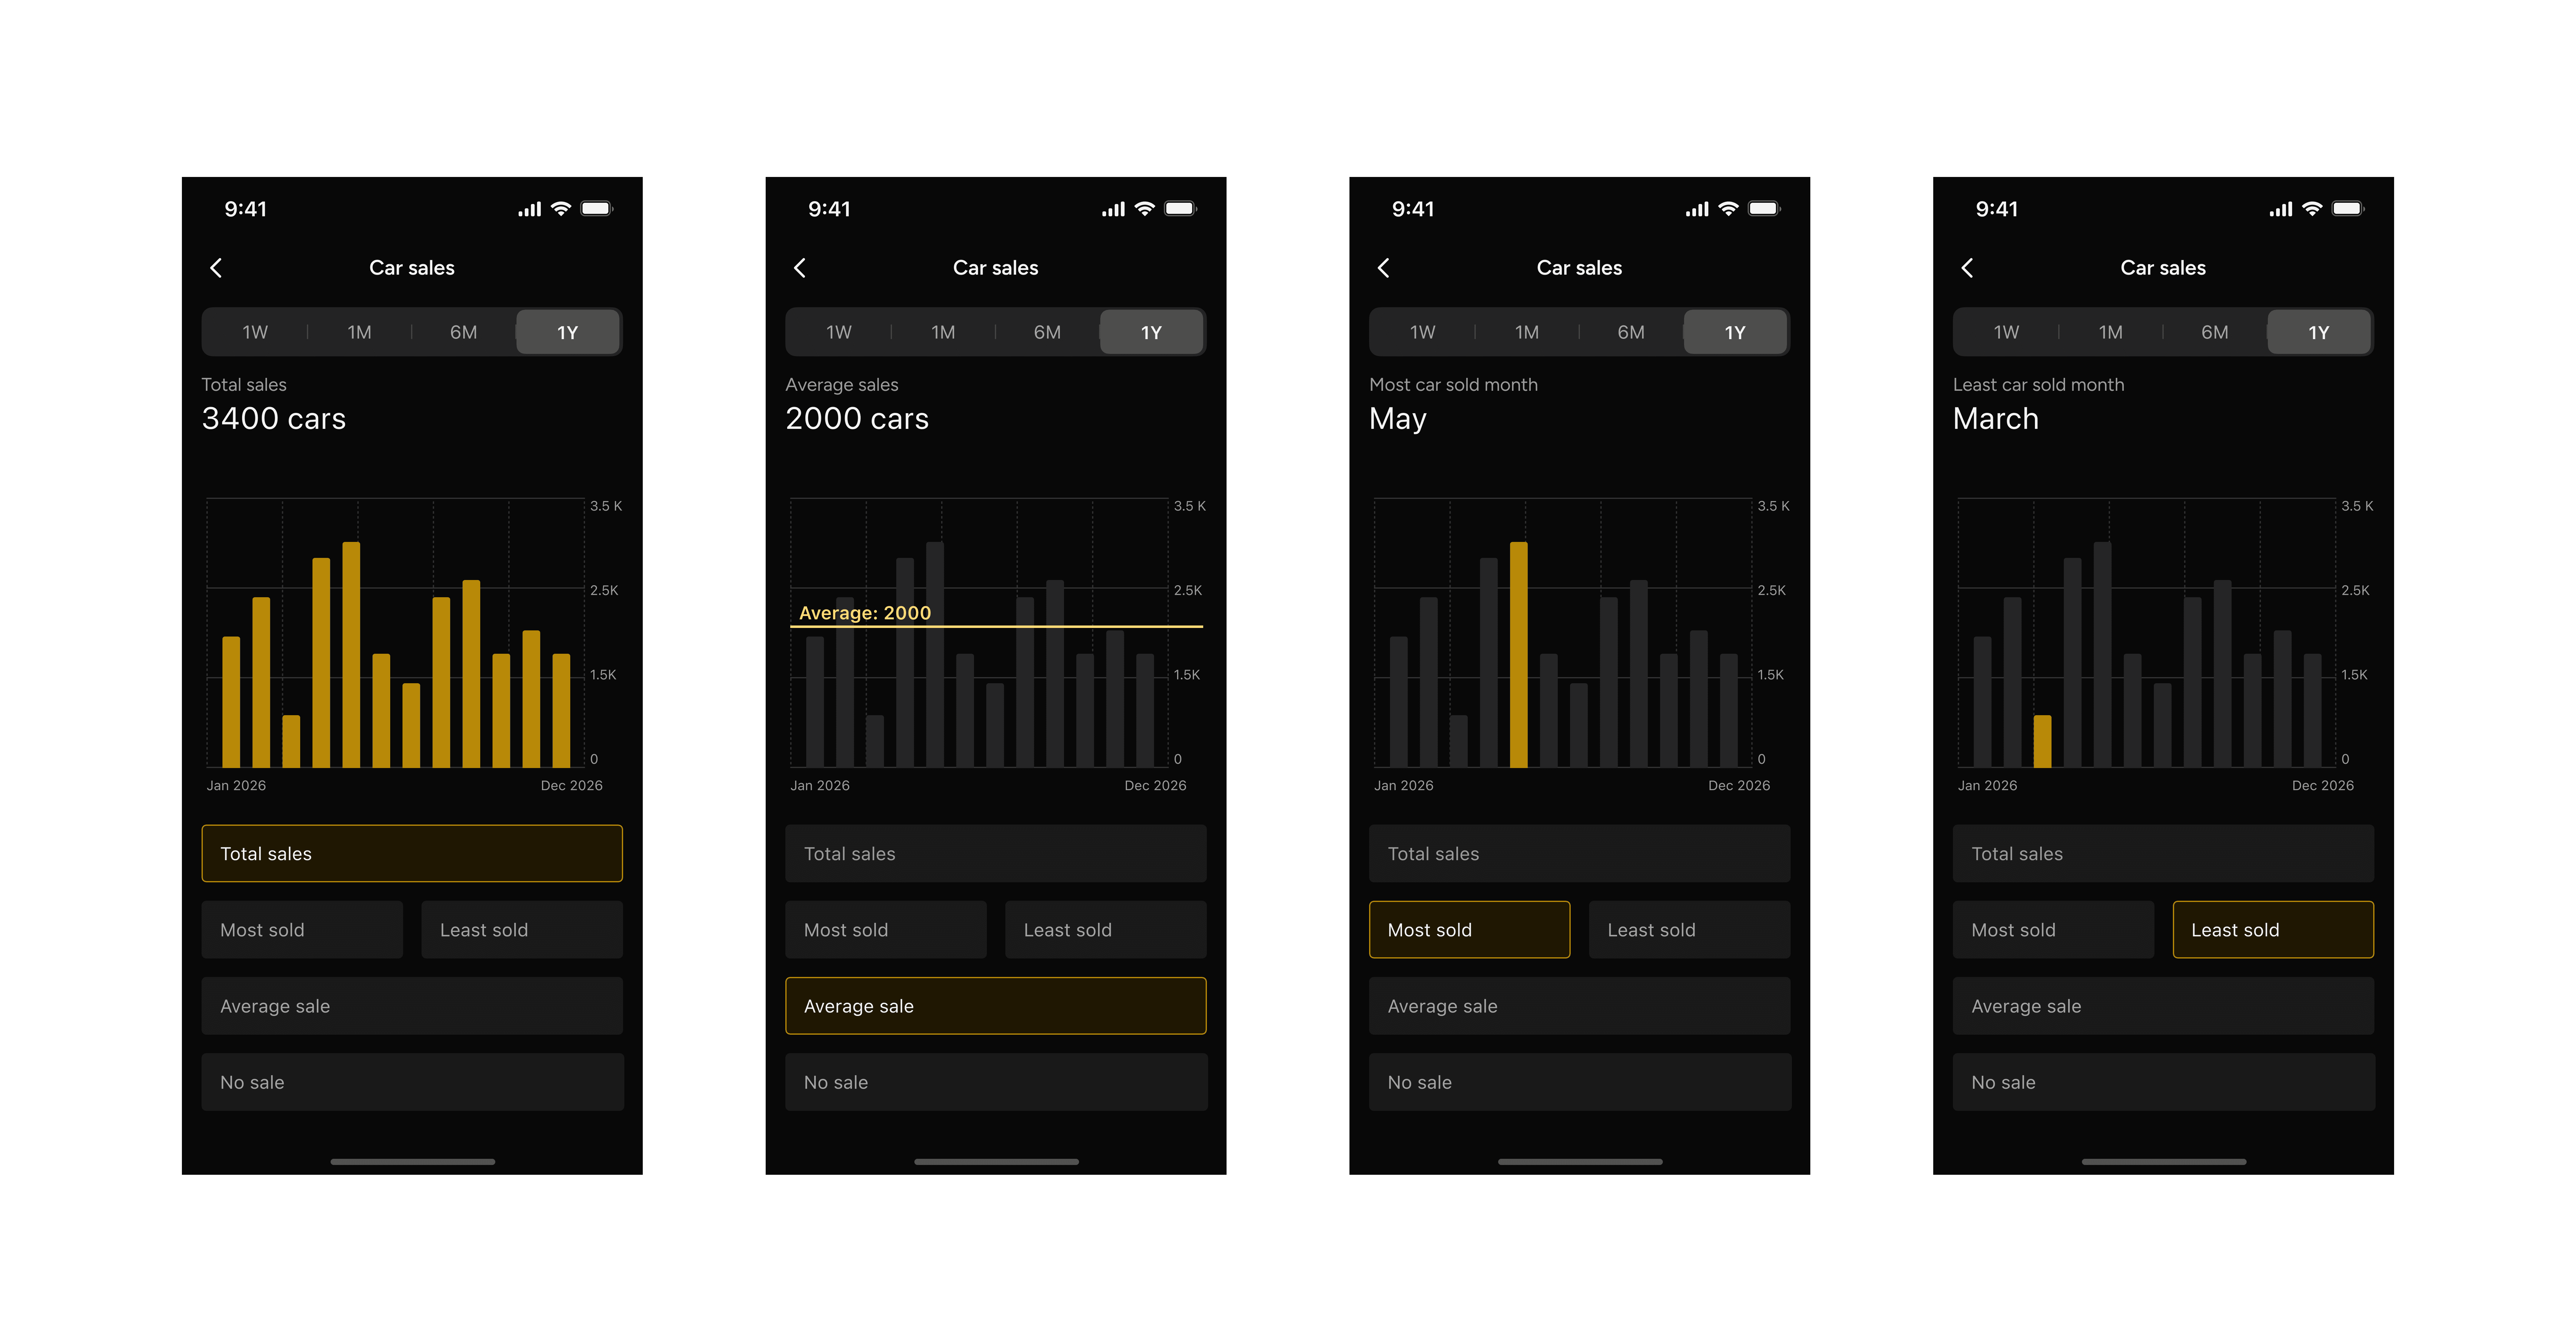
This is the most detailed section of the app. Users can switch between time ranges like 1 week, 1 month, 6 months, and 1 year to understand trends. Bar charts show sales over time, supported by insights such as total sales, highest and lowest performing periods, average sales, and days with no sales.
1 week
1 Month
6 Month
1 Year
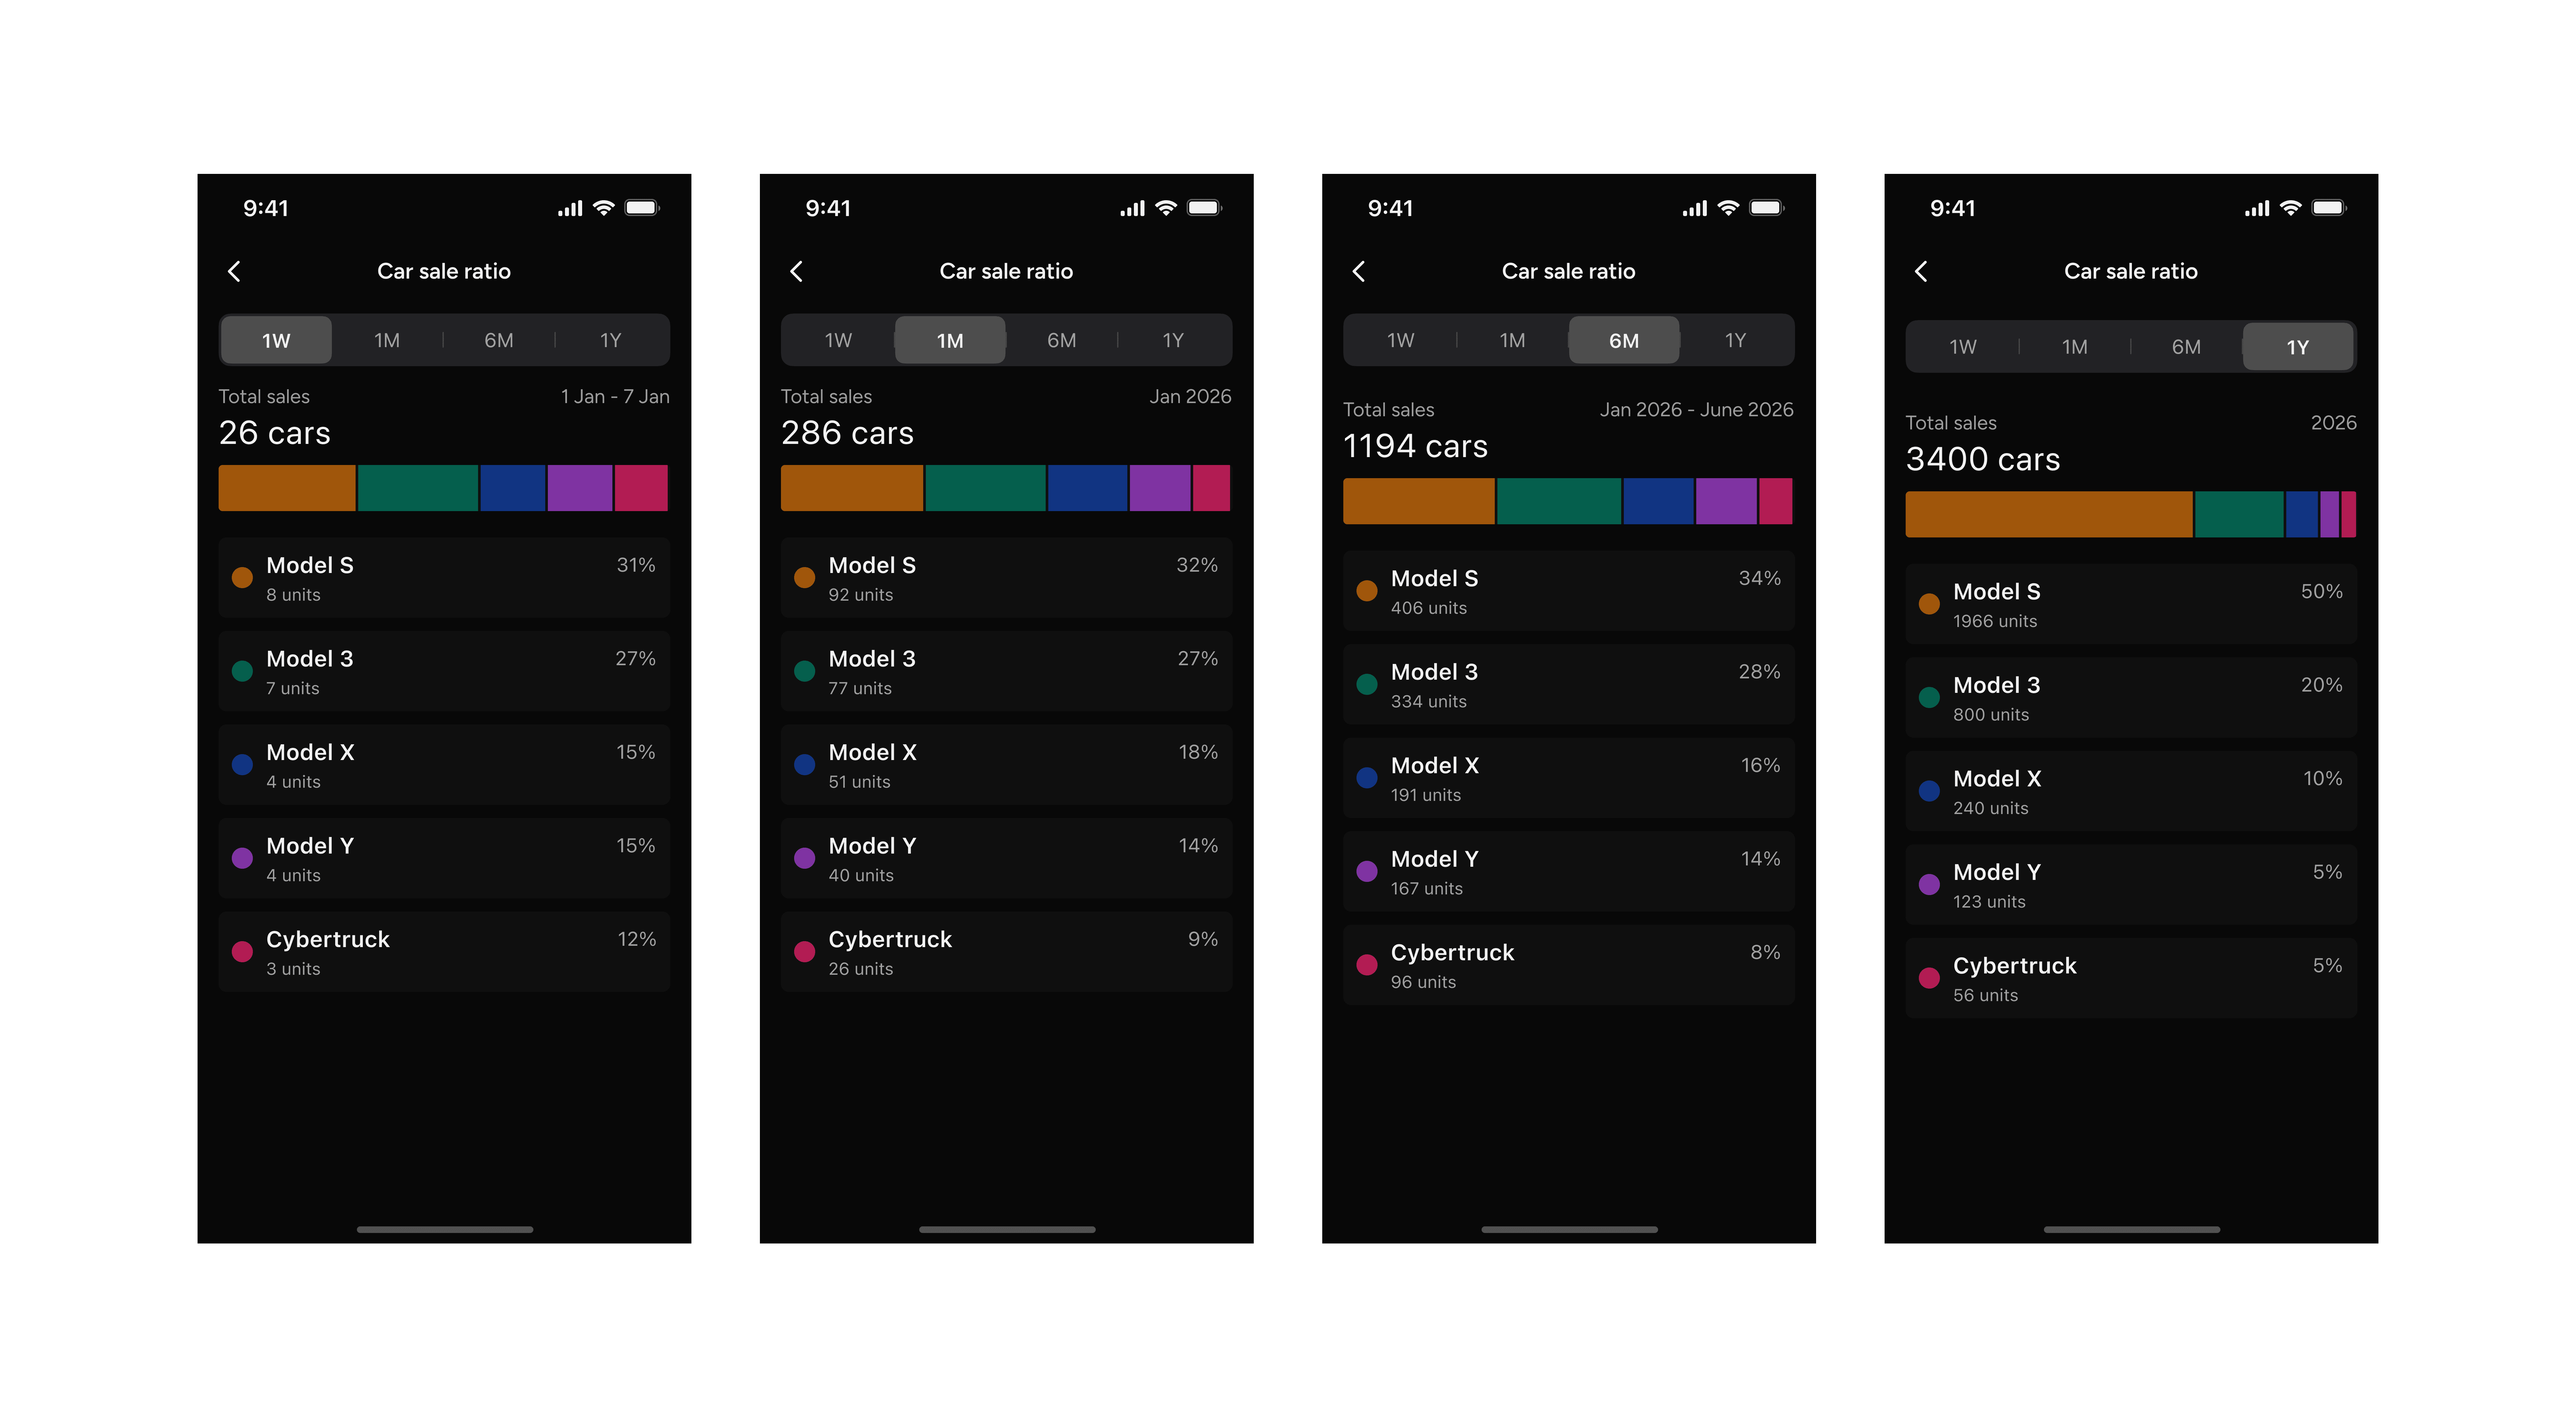
Car Sale Ratio
This section shows how different models contribute to overall sales. It combines a stacked visual with a detailed list to display both percentage share and unit count, helping users understand demand across models.
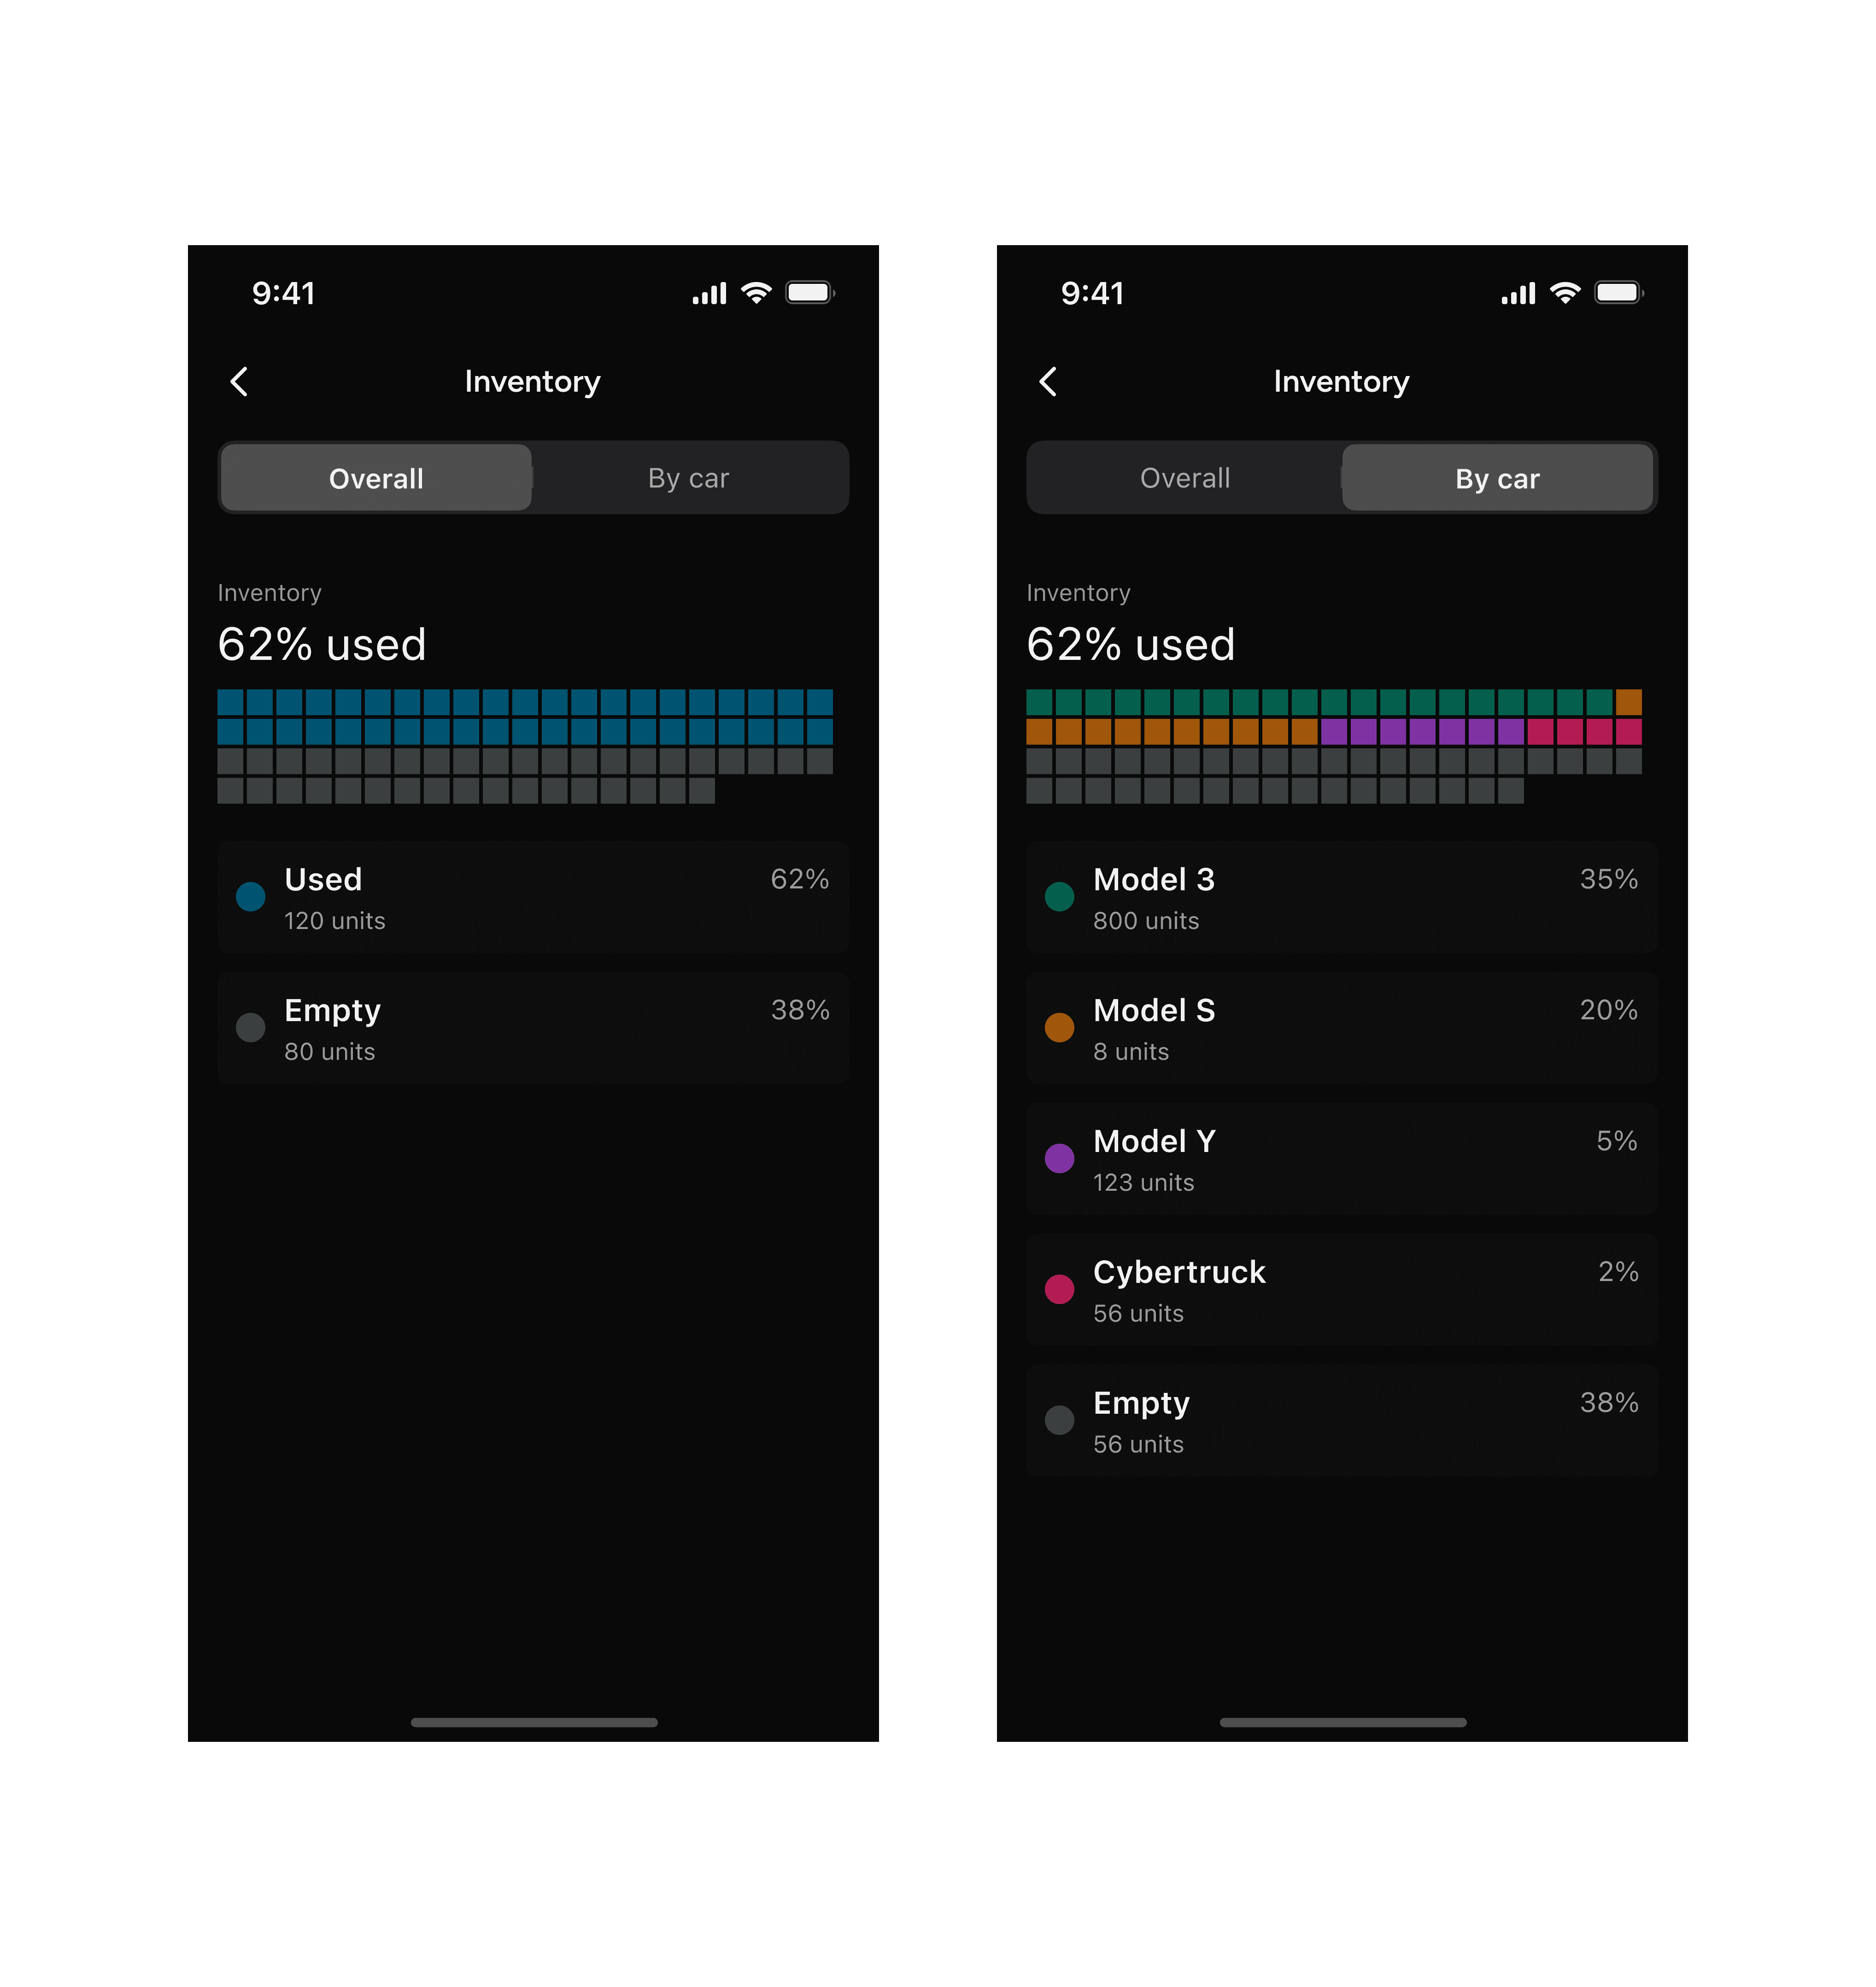
Inventory
This section simplifies stock health into an easy to read occupancy view. Users can quickly see how much inventory is used versus available.